[ MODULE_04 / TERMINAL_MAPPING ]
Execution interface. Market visualization layer.
Trading Foundations #1 — What Trading Actually Is
INITIAL_CONDITION
Capital is ready. But without interface, it cannot be deployed.
Most beginners open the terminal and see chaos. Numbers. Charts. Buttons.
And they lose — not because of the market, but because they don’t understand the structure.
ENTRY_POINT
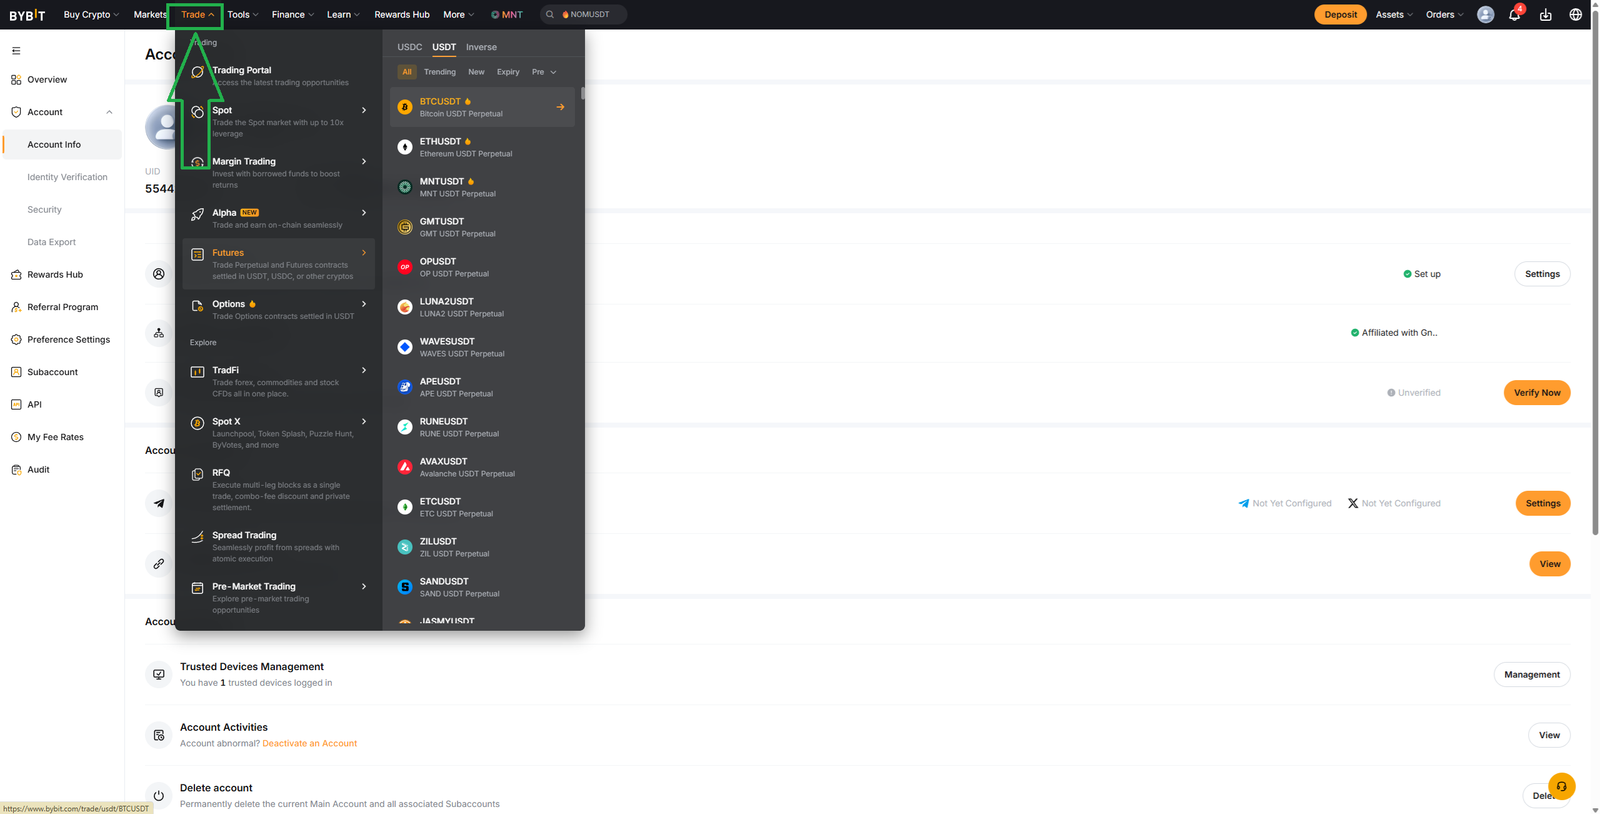
Let’s enter the terminal.
On desktop:
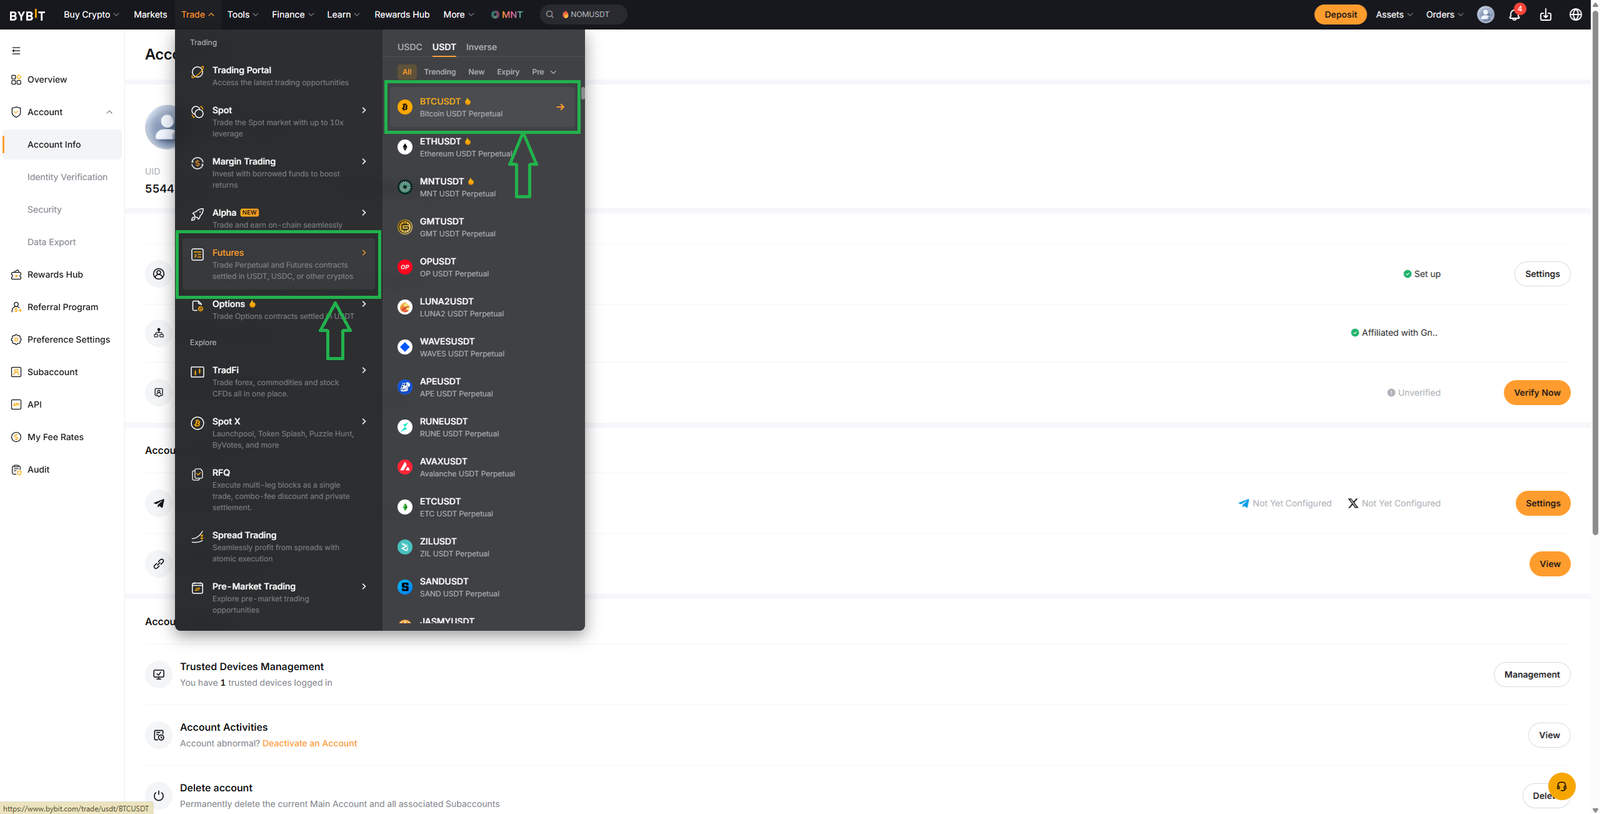
Go to the top panel → “Trade”. Here you can choose- Spot, Futures, Options.
For this series, we will focus mainly on Futures. Why?
Because this is where real trading happens- liquidity, volatility, and full market mechanics.
Spot is simpler — and good for beginners — but Futures show the full picture of the market.
On mobile:
Just tap “Trade” at the bottom of the screen.
In this module, we’re not going deep. We’re building orientation.
This is your map inside the market.
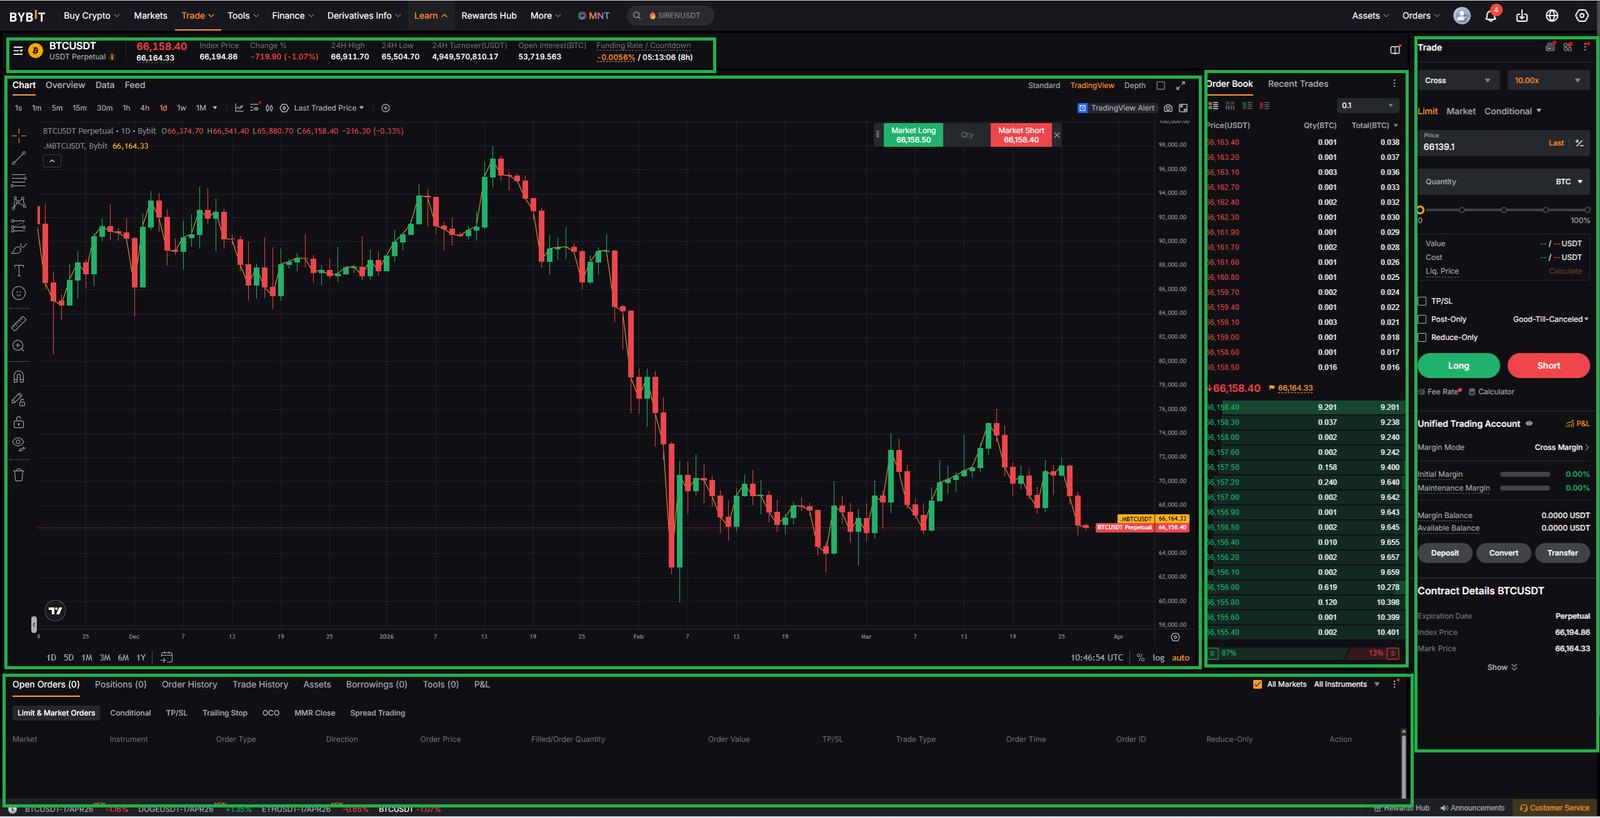
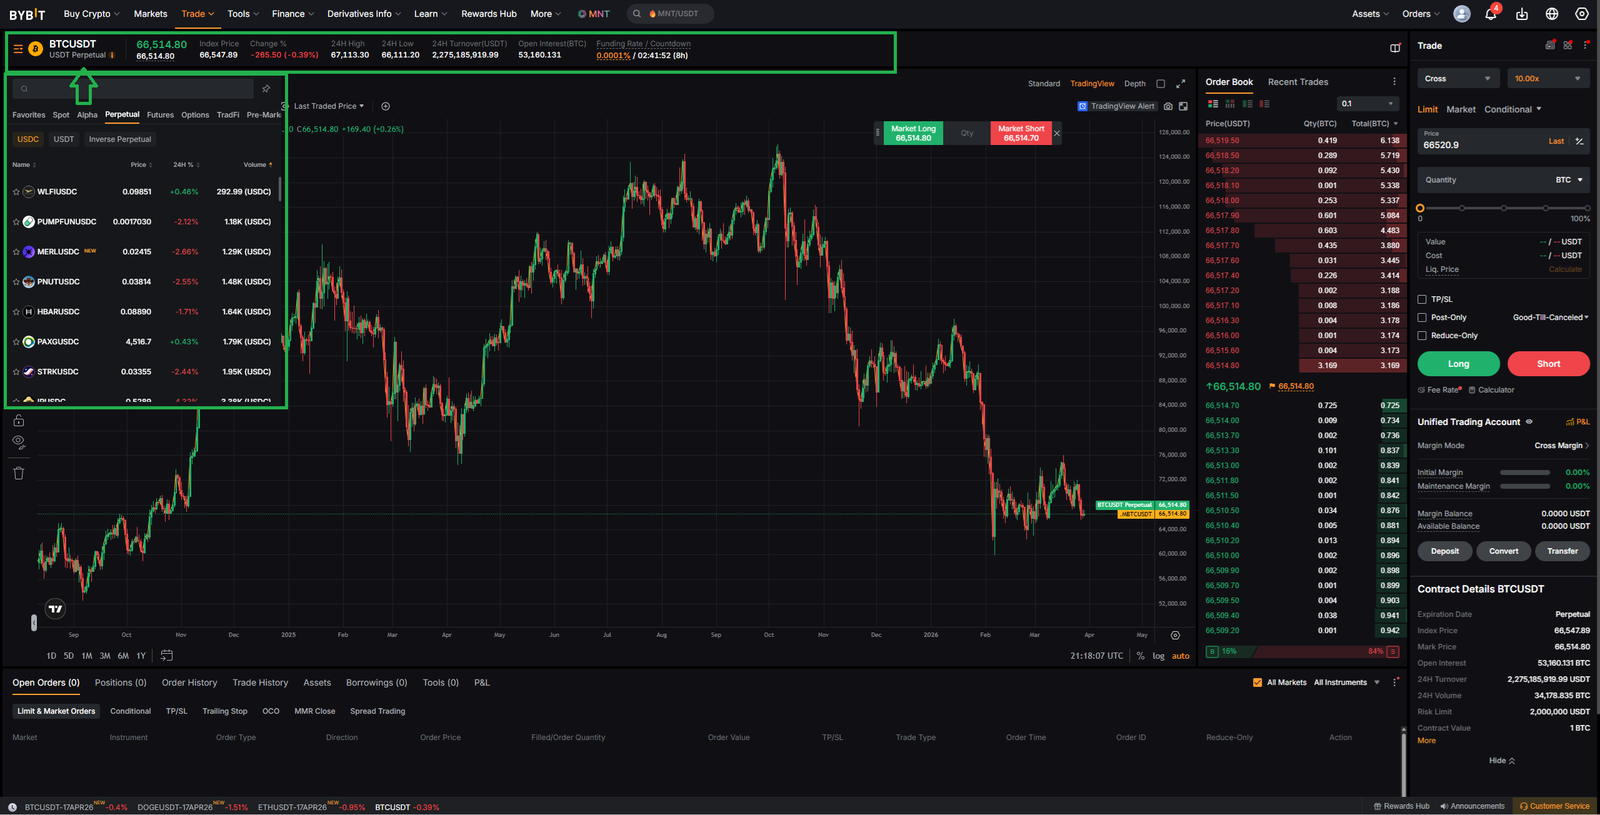
GATEWAY_PANEL
Let’s start at the top. This is your Gateway Panel.
This is where you choose your market:
→ trading pair (BTCUSDT, ETHUSDT, etc.)
→ category (Spot / Futures / Options)
→ favorites and filters.
This defines your battlefield. We focus on USDT pairs. Why? Liquidity.
This is where the largest volume is. This is where the market is most readable.
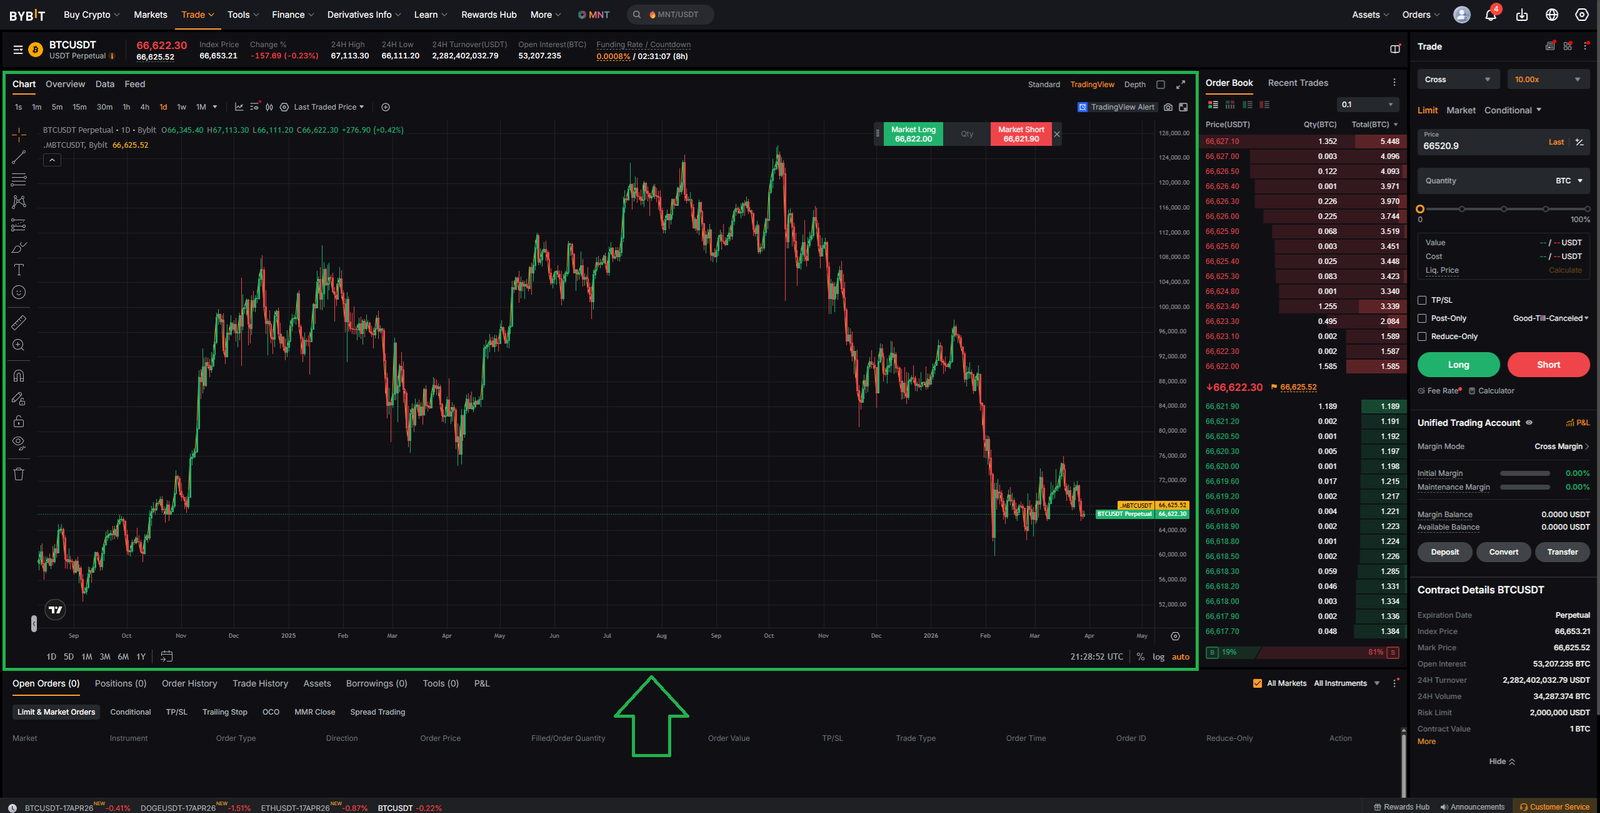
CHART
In the center — the Chart. This shows price movement over time.
But understand this clearly- The chart shows result, not cause.
It tells you what happened, but not why it happened.
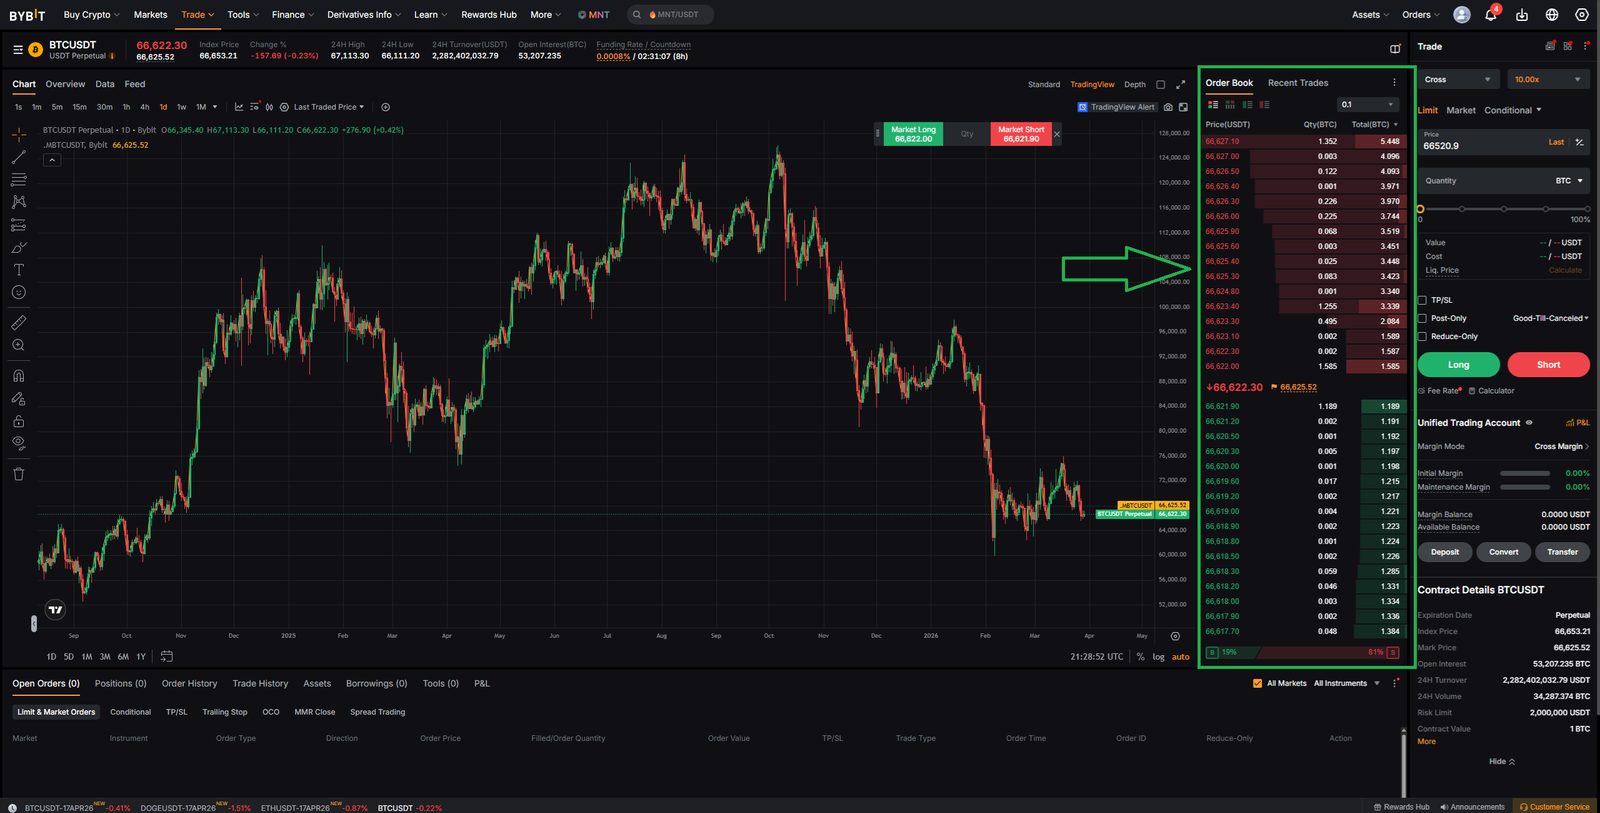
ORDER_BOOK
On the right — the Order Book. This is where things get interesting.
Here you see- buy orders, sell orders, liquidity levels.
This is not history. This is intention. Where traders are willing to act.
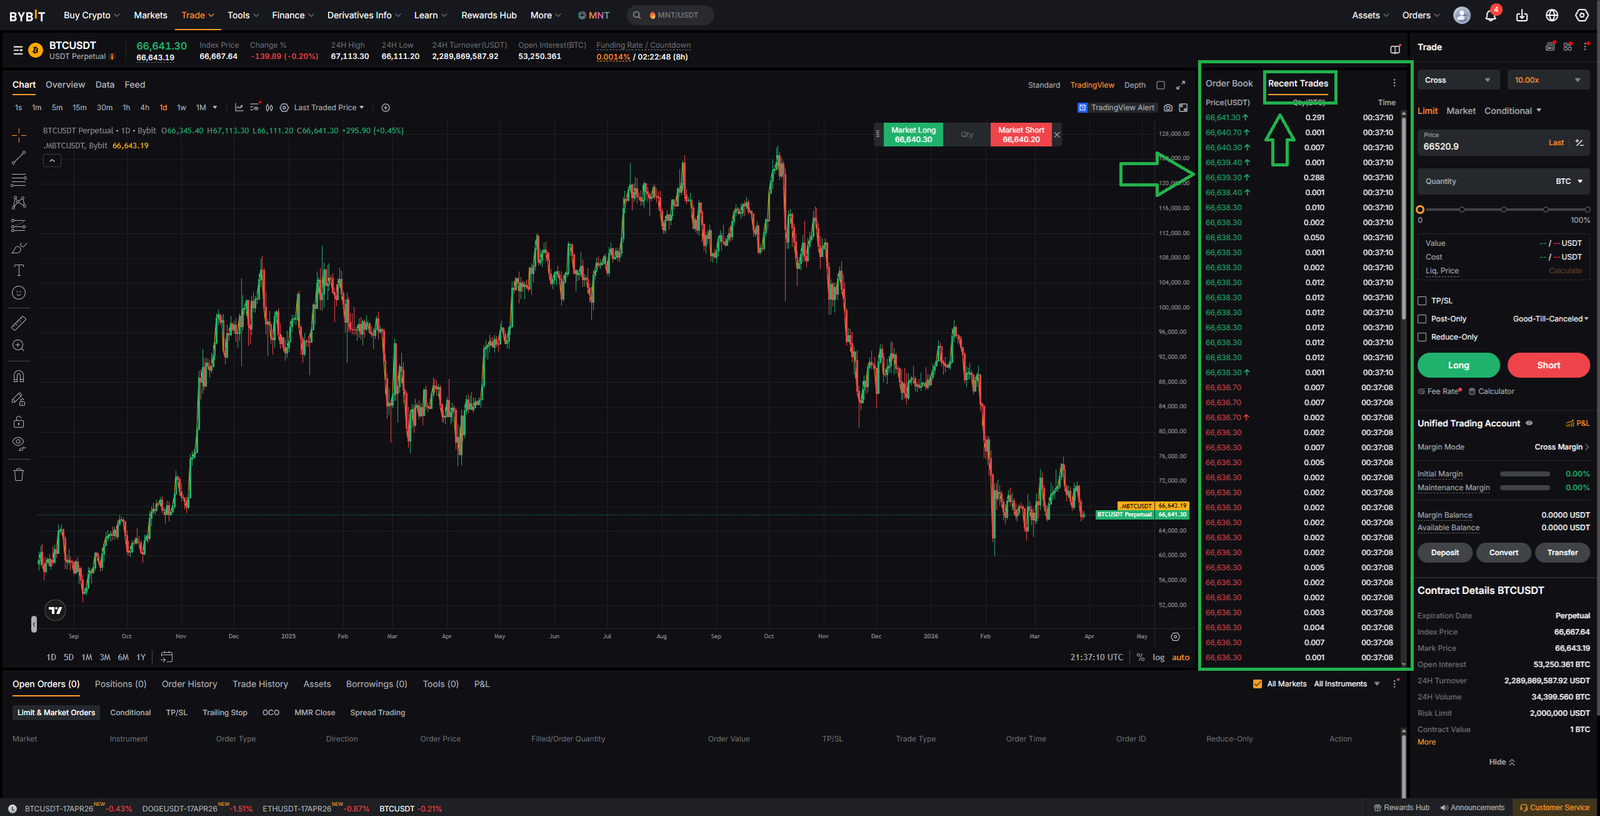
TAPE
Next to it — the Tape (Recent Trades). If the Order Book is intention- the Tape is execution.
This shows- actual trades, real volume, real aggression. This is the moment when intention becomes reality.
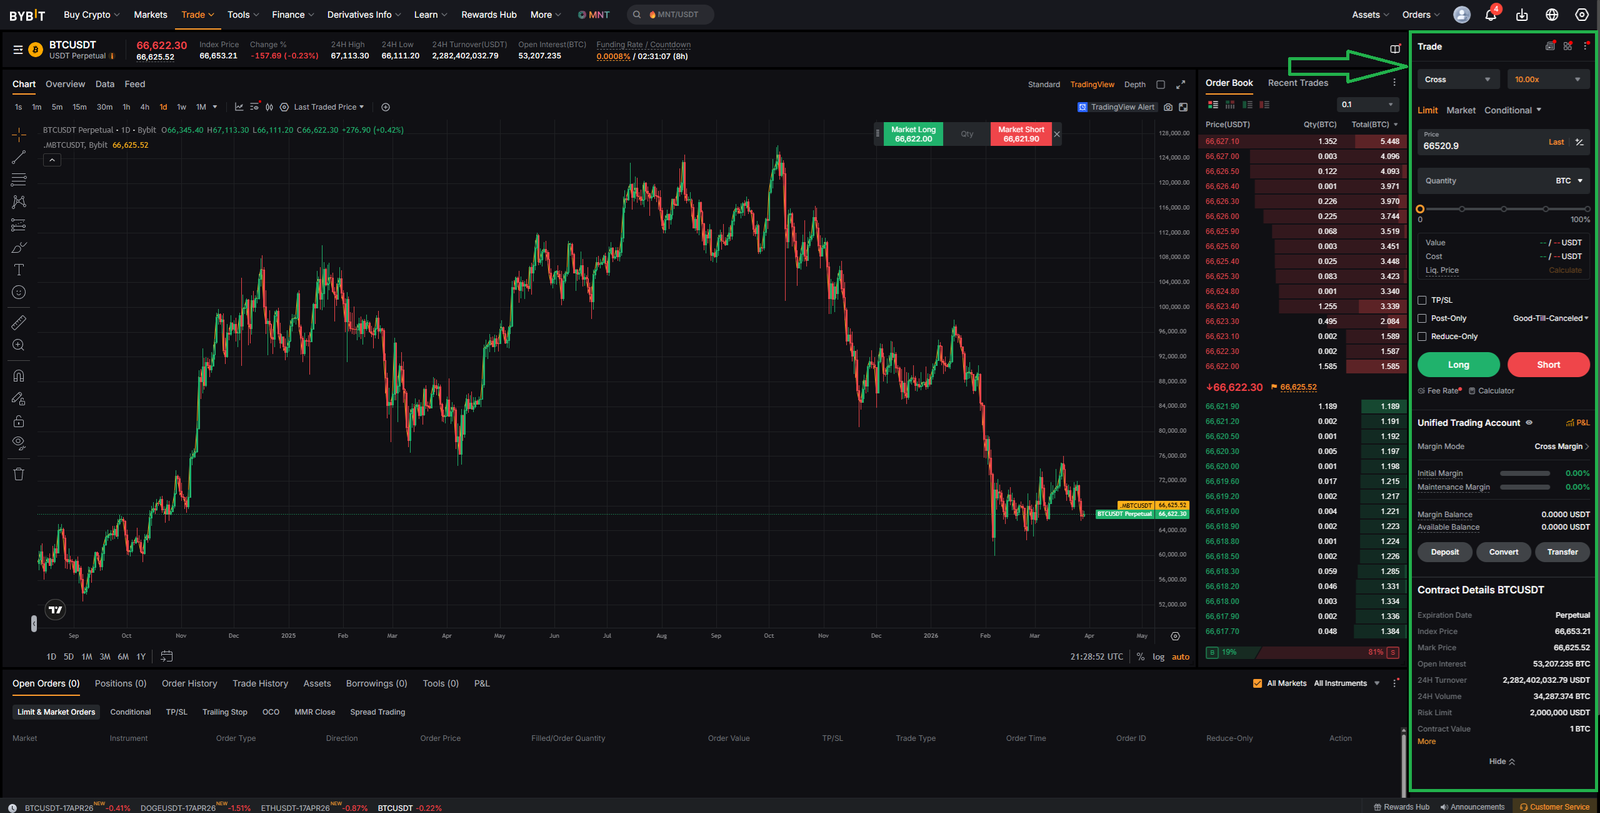
TRADE_PANEL
On the far right — the Trade Panel. This is where you act. You can- open positions, choose order type, set size,manage risk. This is your execution layer.
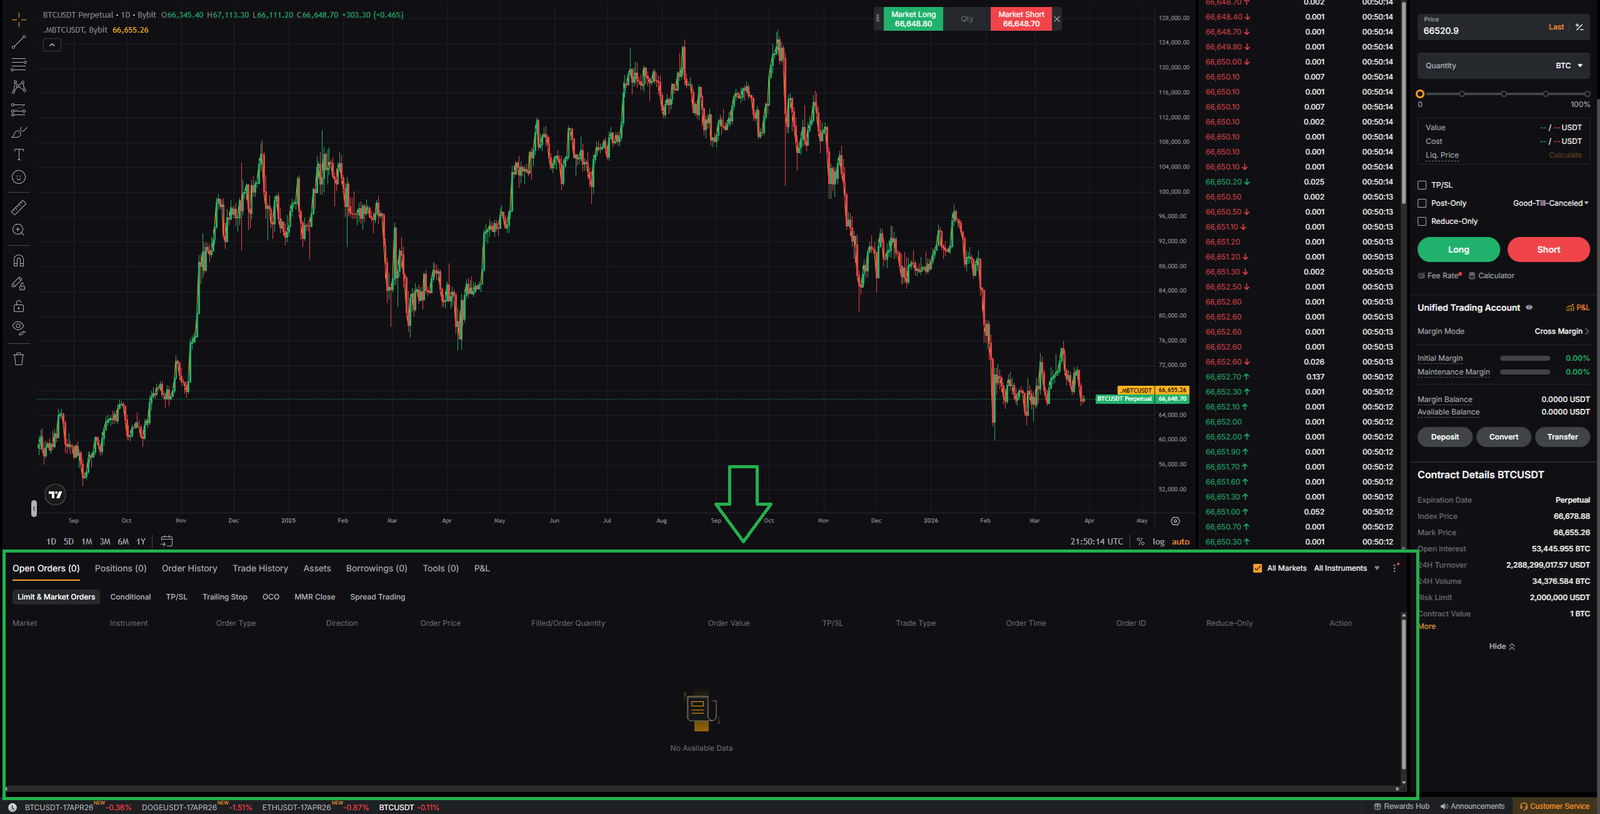
CONTROL_PANEL
At the bottom — your Control Center.
Here you track- open orders, positions, profit & loss, history. Without this panel, you have no control, only exposure.
SYSTEM_VIEW
Step back.
Gateway → selects market.
Chart → shows result.
Order Book → shows intention.
Tape → shows execution.
Panels → control decisions.
Together — complete market structure.
SYSTEM_LIMITATION
Seeing the interface does not mean understanding it.
Without structure, data becomes noise.
NEXT_PHASE
You can now see the system. Next — you need to understand it.
What is being traded // How price moves // How profit is formed
